Andrew Kennedy, REALTOR®
https://www.kennedyrealty.com/blog/uncertainty-and-conflicting-information
Uncertainty and Conflicting Information
Posted By: Andrew Kennedy In: Market StatisticsDate: Wed, Feb 22nd 2023 3:50 pm
 There is more uncertainty and conflicting information regarding the housing market floating around in the media, the real estate profession, and from my personal connections than I have seen since I began real estate.
I would like to take a moment to address the basic variables of sales, inventory, and prices so we can clear up some confusion on these points starting with facts.
I will start with sales for this article:
Closed Sales
The headlines are generally focused on the fact that closed sales dropped 34% in the Charleston market in January, year over year, which means compared to the prior January.
At Carolina One, we generally pay closer attention to written sales than we do to closed sales
Why? While important, closed sales are a lagging indicator that tells you what homebuyers were thinking 30-75 days ago while written sales data tells you what the consumer was thinking last week.
Written Sales
Written sales in our market have been improving steadily measured year-over-year for the past several months.
Week1 November -37%
Week 2 November -37%
Week 3 November -35%
Week 4 November -52%**
Week 5 November -33%
Week 1 December -21%
Week 2 December -29%
Week 3 December -17%
Week 4 December -25%
Week 1 January -17%
Week 2 January -30%
Week 3 January -7%
Week 4 January -12%
Week 1 February -27%
Week 2 February -6%
Takeaways
- It is completely predictable that sales would be -34% in January given where written sales were in November and December (contracts usually take 30-75 days to close)
- January and February look much better year over year than November and December did
- We budgeted 2023 to finish -15% in written/closed sales units
- Industry conventional wisdom is that the first half of the year would be -25% in unit sales year over year and the second half of the year will be flat year-over-year averaging out to -15% for all of 2023
The fact that we are coming out of the gate MUCH stronger than -25% could bode well for the rest of the year
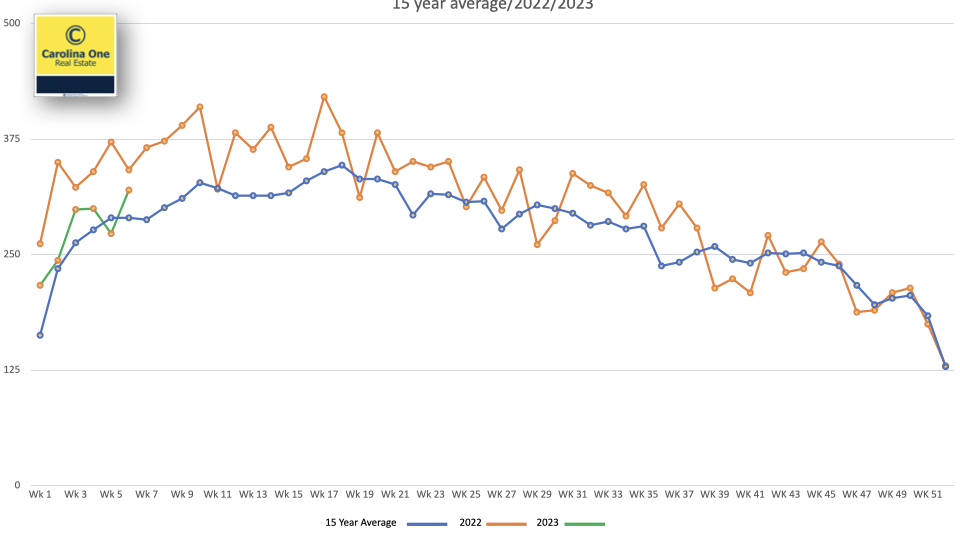
320 properties went under contract last week. This is an above average sixth week of the year for the Charleston housing market and almost exactly where we were in 2019 (with double the inventory to choose from).
So far this year is tracking right at the 15 year average for the Charleston market in terms of written sales. It simply "feels bad" because it is coming off of the "12 cans of red bull" over caffeinated markets of 2020, 2021, and the first half of 2022 that a dozen trillion dollars of printed money covid relief and the associated low interest rates brought to us.
Follow the green line below (this year) versus the blue line (15 year average).